Training Center
Trading Methodologies
Fundamental Analysis
When it comes to FX trading, there are two types of market analysis which most traders default to: fundamental analysis and technical analysis. Let’s first take a look at the former. Fundamental analysis refers to the studying of the economic fundamentals of a currency, economy or country, and it can be a very powerful method for traders to predict the future health of a country’s economy, which in turn may allow you to predict the future health of that respective country’s currency.
One of the more prominent tenets of Fundamental Analysis is the study of economic data releases, which, simply put, is a form of trading which relies on market sentiment created by global news. There are literally hundreds upon hundreds of economic data releases on any given day. Every country in the world will be constantly releasing data such as Gross Domestic Product, trade balance, retail sales, unemployment rates, so on and so forth. Our Economic Calendar allows you study news releases of countries and observe their expected market impact, and many traders will find it extremely helpful to keep a close eye on news headlines from the countries relevant to their investments.
Here are some factors which Fundamental Analysis believes are highly useful when it comes to determining the health of global economies:
Interest Rates
Money is what makes the world go round, and it is exchanged freely between currency to currency on a global scale. In most cases, when a country raises its interest rates, the country’s currency gets stronger in relation to other currencies as assets are shifted away from it to gain a higher return elsewhere.
A hike in interest rate may not always be a good thing for the stock markets, however—this is because is it common for many investors to withdraw money from a country’s stock market when there is an increase in interest rates, as it will cause a country’s currency to weaken. It is worth noting that the timing of interest rate movements is typically known in advance. It is no secret that these interest rate moves often take place after regular meetings of the Bank of England (BOE), the US Federal Reserve (Fed), the Bank of Japan (BoJ), the European Central Bank (ECB) and other central banks.
Trade Balance
The net difference between the imports and exports of a nation over a set period of time is known as its trade balance. When the value of a nation’s imports begins to exceed that of their exports, the trade balance will denote a deficit, something which is commonly regarded as being unfavorable to a country’s economic health. Conversely, if trade figures demonstrate an increase in exports, funds will flow into the country and increase the value of their currency.
There are cases, however, where having a trade deficit is not a bad thing. A deficit creates unfavorable market conditions only when it is greater than market expectations and will, as a consequence, mark a turning for a price to begin moving downwards.
Gross Domestic Product
The Gross Domestic Product of a country refers to the total market value of all goods and services produced either by domestic or foreign companies within a given country’s borders. The rate of growth of a country’s economy is indicated by its GDP and is widely regarded by traders around the world as one of the broadest indicators of a country’s economic output. Usually, GDP is measured on an annual basis, which means that the current GDP rate is reflective of the comparison between current growth and that which was seen during the previous year.
The GDPs of different countries may be compared against one another through the conversion of their value in national currency according either to exchange rates prevailing on international currency markets or the purchasing power parity (PPP) of each currency relative to a selected standardized currency (typically the US Dollar).
Technical Analysis
Technical Analysis relies on the usage of charts such as those found in the FXOAK MT4 Trader. Charts allow traders to study historical price movements to determine the future direction of an asset’s price. The basic idea behind Technical Analysis is that everything that is important to a trader (i.e., everything which affects an underlying asset) has already been reflected in its price. If the only important thing in the study of a financial market is the price of an asset, then price action is the only thing a trader needs to pay attention to and understand in order to trade—that is the premise of Technical Analysis.
While the study of price charts remains very subjective, on a broad level, trading off Technical Analysis can be thought of as a self-fulfilling prophecy—that is, that traders will trade according to price patterns they observe, in turn reinforcing those very patterns.
Both the FXOAK MT4 Trader and FXOAK FX Derivatives Trader allows you to trade directly off charts through the MT4 platform itself. Here are some different types of price charts which you should familiarize yourself with so as to ensure you will be able to utilize them to their full potential and gain an edge on the international FX market:
Line Chart
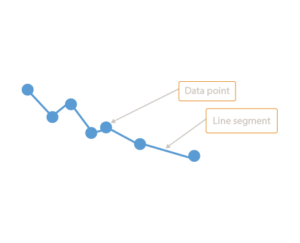 While line charts provide the least amount of data as compared to other price charts, they are extremely handy for determining trends at a quick glance. This is a case where less may indeed be more, with the chart only displaying the current and close price of an asset.
Many traders believe the close is the most important price of the day, and this is where the line chart shines, with its simplicity allowing trends to be defined without extraneous information. Due to the limited amount of information provided in a line chart, however, it is important to note that it is not ideal for traders looking to place Stop Loss or Take Profit orders.
Bar Chart
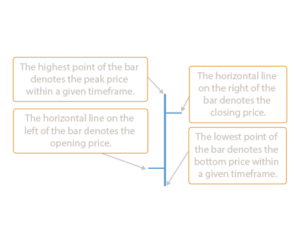 The bar chart is graphed with the use of bars, as its name suggests. Each bar has a high (top) and a low (bottom) indicator with a line on either side, the left side denoting the closing price of an asset during the selected time period, and the right side denoting the opening price of an asset during the selected time period.
Traders often look at bar charts to observe range comparisons. Should a bar’s range be completely outside a previous bar or inside a previous bar, you will have identified a spot of indecision which can signal an upcoming shift.
Candlestick Chart
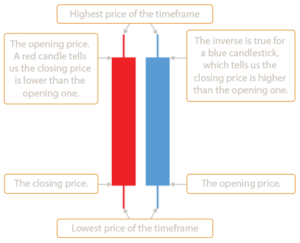 Candlesticks are comprised of a body which represents the relative difference between the close an open prices of a given timeframe. A down candlestick occurs when the close is lower than the open, and an up candlestick occurs when the close is higher than the open.
The thinner lines extending beyond the body are known as Wicks, with the line beneath the body denoting the low for the selected timeframe, and the line above the body denoting the high for the selected timeframe.
Training Center
Derivatives Trading
Daily FX
Trading Share
Trading Strategies
Trading Methods
High Risk Investment Warning: Derivative options trading involve significant investment risk, we strongly recommend that you read and understand the terms and conditions. Although every independent risk derivative options trading are flxed. However being a trader,the investment operation is flexible,which may cause you to lose partially or all of the original investment, especially if the trader invest on single online trading product. We strongly recommend investors to choose an appropriate tradiing method and asset management make good control of consecutive trading and total investment.
Regional Restrictions:We does not provide services to residents of the United States, British Columbia, Canada, Australia, Belgium, France, etc.